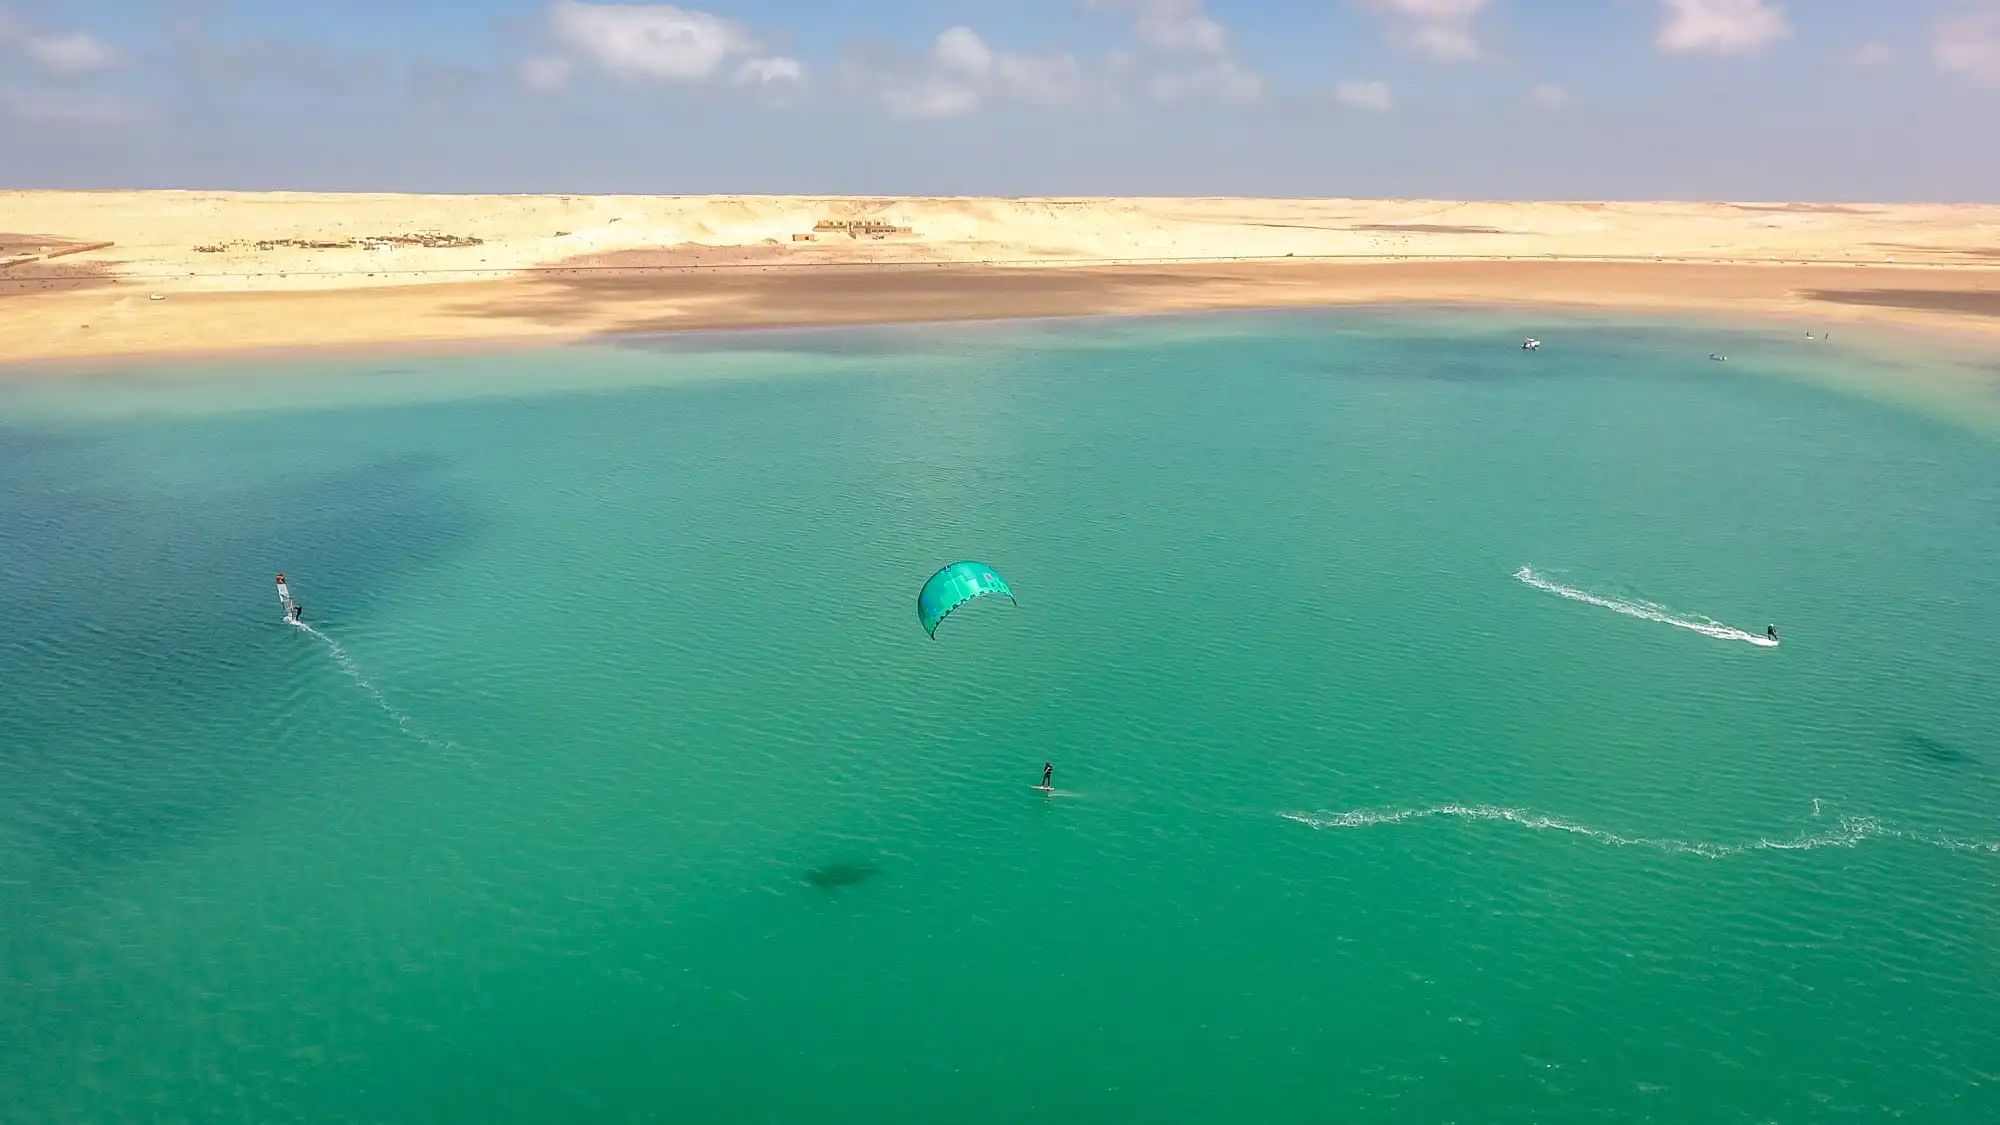
Cape Town: 47% rideable days on average over the year. Dakhla: 80% rideable days on average over the year.
Cape Town wins 1 months out of 12 (Dec). Dakhla wins 9 months out of 12 (Feb, Mar, Apr, May, Jun, Jul, Aug, Sep, Oct).
Best time for Cape Town: November to February. Best time for Dakhla: January to November.
Windiest month for Cape Town: January (70% rideable days, 16 kts when it blows, 22 °C). Windiest month for Dakhla: May (93% rideable days, 16 kts when it blows, 20 °C).
Cape Town or Dakhla: which one is windier?
Cape Town: 47% rideable days on average over the year. Dakhla: 80% rideable days on average over the year. Cape Town wins 1 months out of 12 (Dec). Dakhla wins 9 months out of 12 (Feb, Mar, Apr, May, Jun, Jul, Aug, Sep, Oct).
Cape Town or Dakhla: when is the best kitesurf season?
Best time for Cape Town: November to February. Best time for Dakhla: January to November. Windiest month for Cape Town: January (70% rideable days, 16 kts when it blows, 22 °C). Windiest month for Dakhla: May (93% rideable days, 16 kts when it blows, 20 °C).
Cape Town or Dakhla: which one is warmer?
Cape Town: 17 °C average air temperature over the year. Dakhla: 21 °C average air temperature over the year.